What it does
For each radiology service, Workforce Sizing works out how many senior medical officer (SMO) FTE the incoming work needs and compares that with the FTE the service has. Every service is sized the same way, so the figures can be compared across the country.
Work in
Examination volumes by modality and complexity, and the clinical work that is not reporting: meetings, procedures, teaching and supervision.
Calculation
The work becomes clinical hours, and the hours become a required FTE, using the service's own leave and non-clinical allowance.
Gap out
Required FTE less the FTE on the roster is the gap. Each grain is marked understaffed, adequate or overstaffed, and the figures add up to district, region and national totals.
Grains and workload
Four ideas explain most of the screens: the grain, its archetype, time constants, and the split between reporting and other clinical work.
The hierarchy
Regions and districts come from Site Profiles. The grain is this tool's own unit.
The grain
A grain is a planning unit: one radiology service, covering one or more facilities. Its inputs are kept on the grain (volumes, activities, meetings, FTE settings and staffing), and the calculation runs per grain before the results are added up. A satellite facility joins its parent's grain. An administrator can merge two grains that share one group of SMOs, and undo the merge later. As of November 2026 there are 56 grains in production.
Archetypes
Each grain has an archetype from XL to XS. In the Library, each standard activity and meeting is marked as a default for one or more archetypes.
Modalities and time constants
Demand is counted per modality. Each modality and complexity pair has a time constant, the minutes it takes to report one examination, which turns volume into reporting hours.
CT, MRI, ultrasound, X-ray, nuclear medicine, mammography and fluoroscopy.
Reporting and CNR
SMO clinical time is split in two. Reporting grows with examination volume. All other clinical work is clinical non-reporting (CNR), in four categories.
Non-clinical time is a percentage allowance set on FTE Config. Non-clinical activities can be listed for the record, but they add no hours.
Staffing figures come from Site Profiles and are read-only here. The grain list goes the other way: Site Profiles, the identity hub and My HNZ Radiology read their grains from Workforce Sizing.
The calculation
Every figure in a result can be traced back to an input. The calculation has four steps.
Reporting workload
For each modality and complexity, annual volume times minutes per report, converted to hours.
Non-reporting workload
The hours of every CNR 1 to 4 activity, plus the preparation and attendance hours of each MDM and recurring meeting.
Clinical hours per FTE
Standard annual hours less leave (annual, public holidays, training, sick and other) gives productive hours. The non-clinical percentage comes off that.
Required FTE and the gap
Total clinical hours divided by the hours one FTE gives, compared with effective FTE: diagnostic SMO FTE, less on-call FTE, plus the share of interventional radiologist time that goes to reporting.
Try the calculation
Move the sliders. The calculator runs the four steps above with the app's default assumptions: 2,086 standard hours, less 240 hours of annual leave, 96 of public holidays, 80 of training and 60 of sick leave. In the app, each grain uses its own saved settings.
Inputs
Result
The app marks a grain understaffed when it needs more than 0.5 FTE above its effective FTE, overstaffed when it has more than 0.5 FTE to spare, and adequate in between. The 0.5 is a national setting that an administrator can change. A grain with no volumes shows no result.
The screens
Two national views, a page for each grain with Analysis and Configuration tabs, and pages for administrators.
National Overview
Totals across the grains a person can see: the number of grains, current and required FTE, the FTE gap, and how many grains are understaffed or adequate. Each grain links to its own page.
Compare Grains
Several grains in columns: required and effective FTE, the gap, on-call FTE, reporting, CNR and total clinical hours, the per-FTE hours, the non-clinical percentage, archetype, district, each modality's time constants and the hours in each CNR category. It shows why two services of a similar size come out differently.
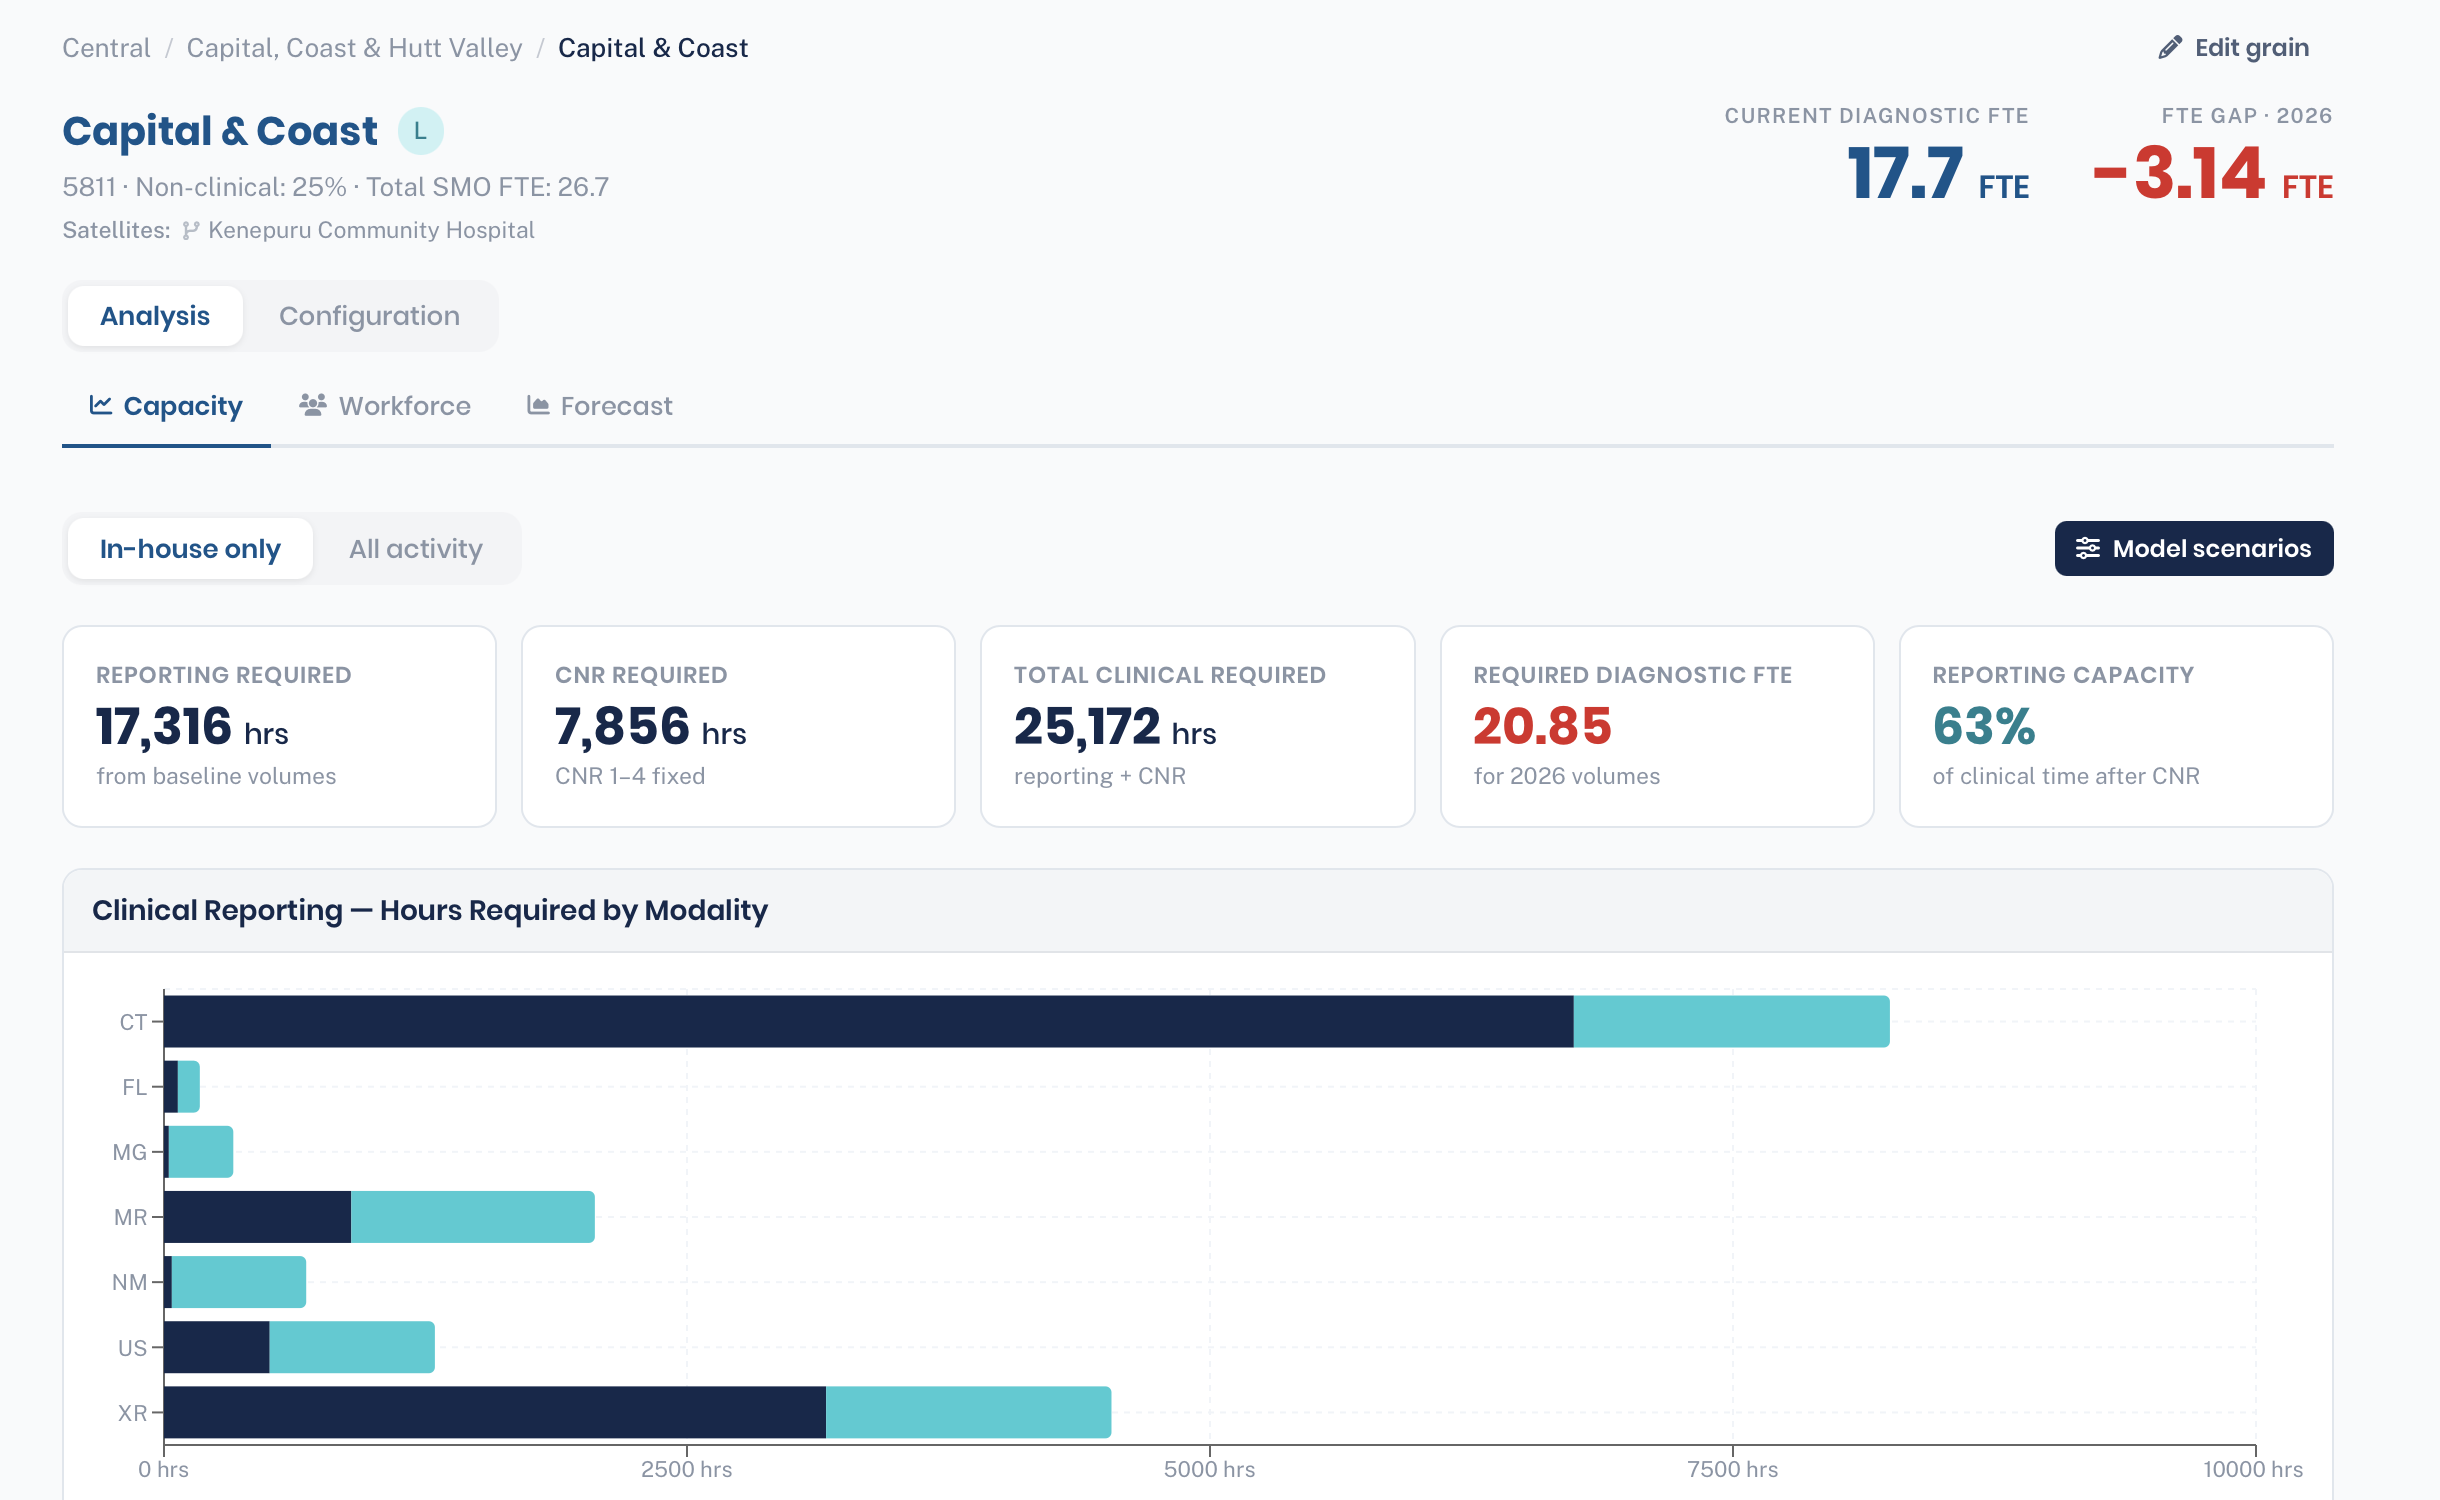
A grain's page opens on the Analysis tabs, which show results. The header gives the grain's current diagnostic FTE and its FTE gap for the year. The header shows a shortfall as a minus figure (for example −3.14 FTE), the opposite sign to the gap in the calculation above and in the Scenario Planner.
Capacity
The grain's result in five figures: Reporting Required, CNR Required and Total Clinical Required, all in hours, then Required Diagnostic FTE and Reporting Capacity. A note above them says whether the figures come from demand volumes or baseline volumes.
- In-house only and All activity switch between in-house work and in-house plus outsourced work, for grains that record outsourced volumes.
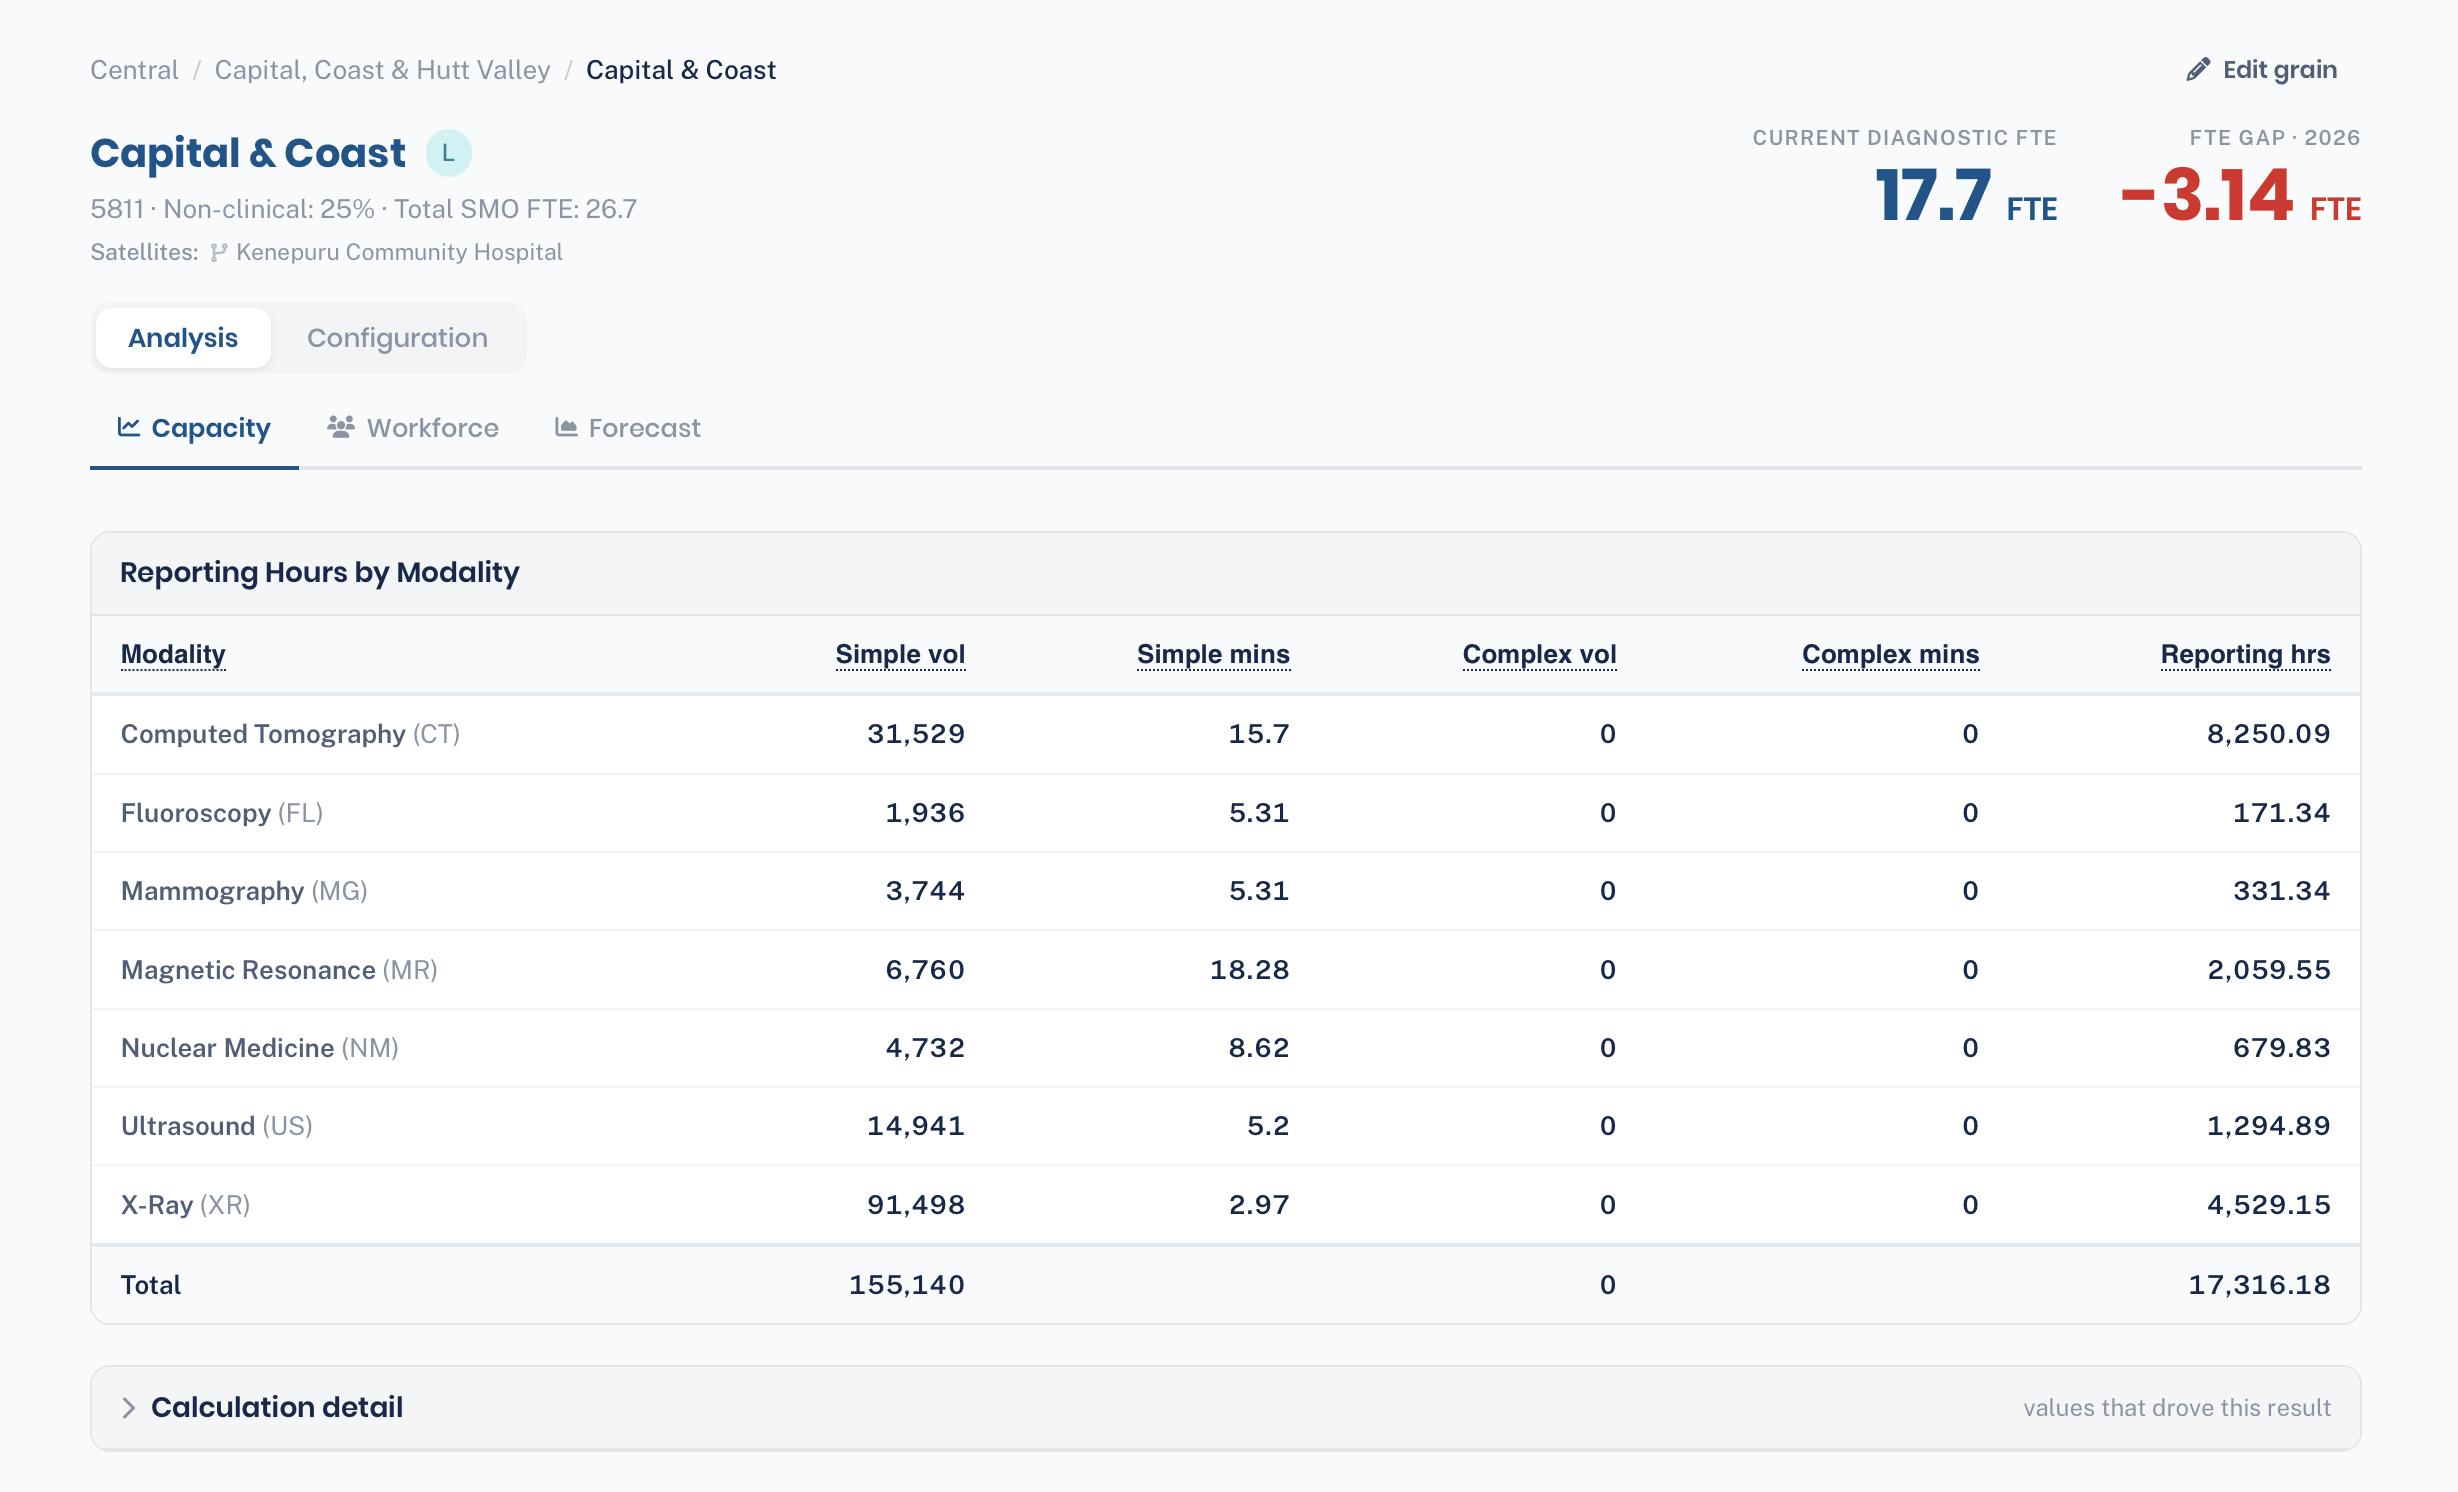
- Calculation detail opens the full working, down to the effective FTE used.
Scenario Planner
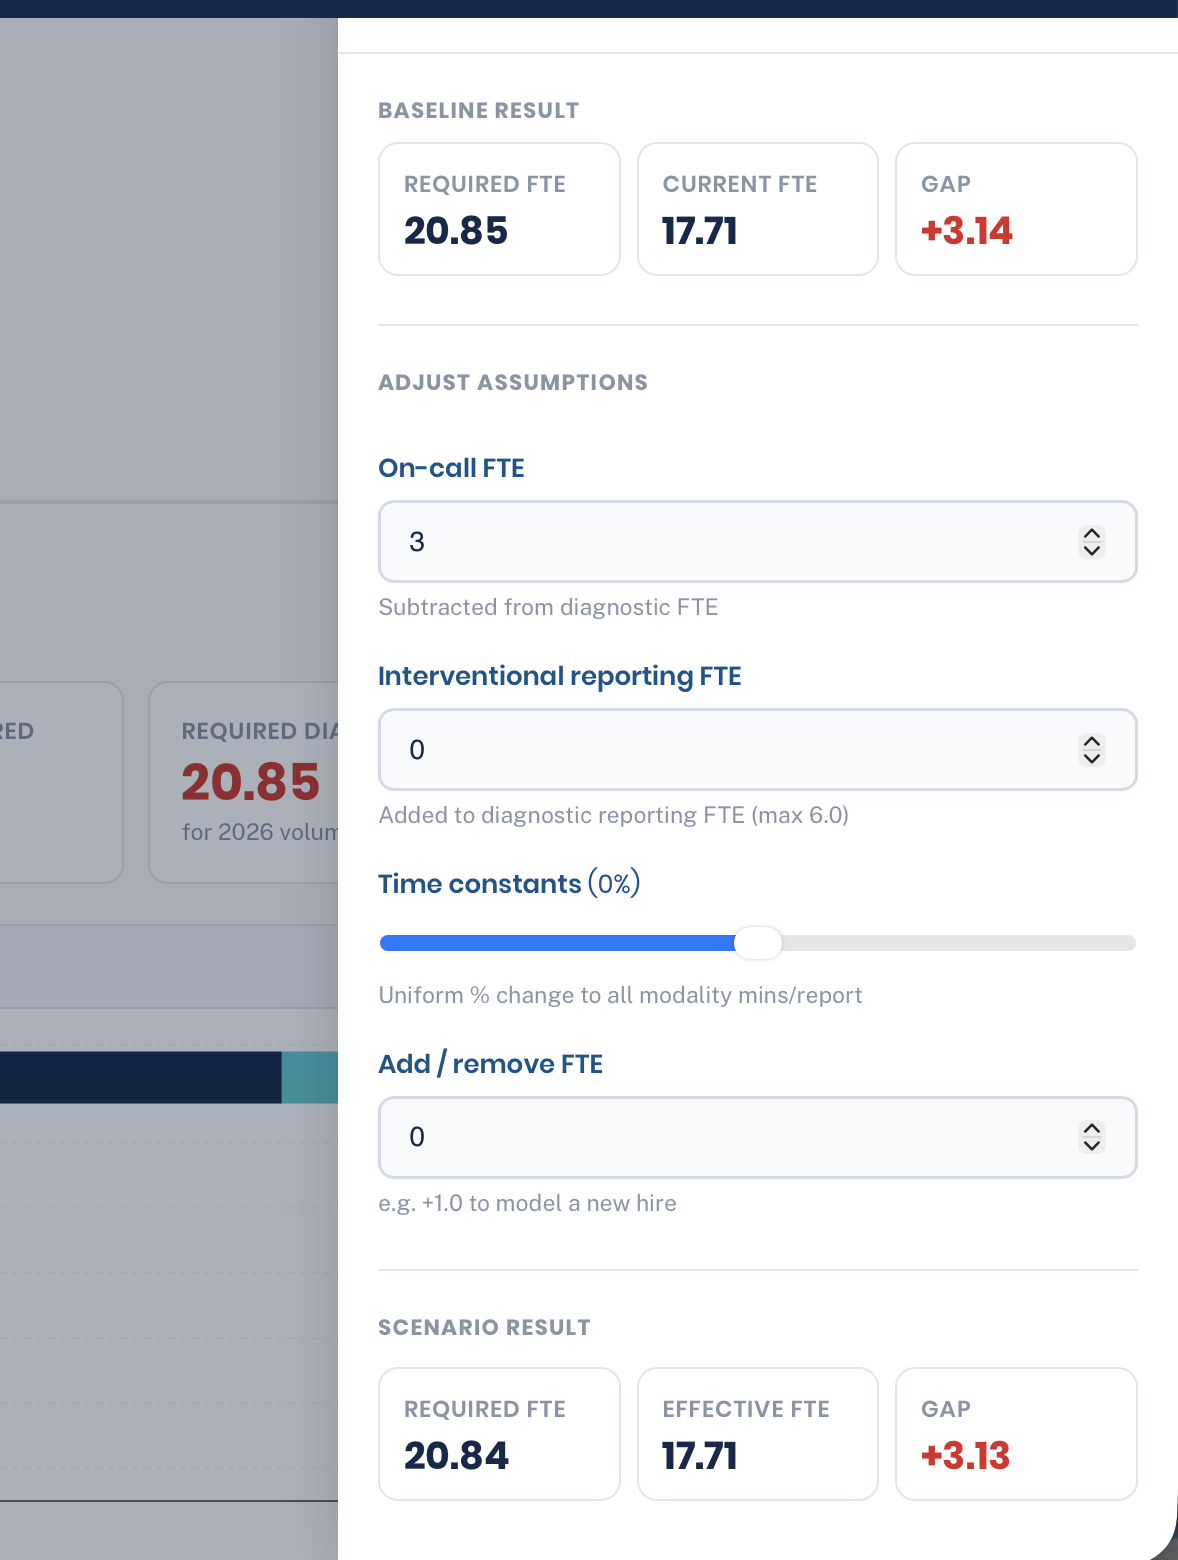
The Model scenarios button on the Capacity tab opens the Scenario Planner. It shows the baseline result, four assumptions to change, and the scenario result beside it. Nothing changed here is saved to the grain.
- On-call FTE, subtracted from diagnostic FTE.
- Interventional reporting FTE, added to diagnostic reporting FTE.
- Time constants, a uniform change of −50% to +50% to every modality's minutes per report.
- Add / remove FTE, for example +1.0 for a new hire.
Workforce
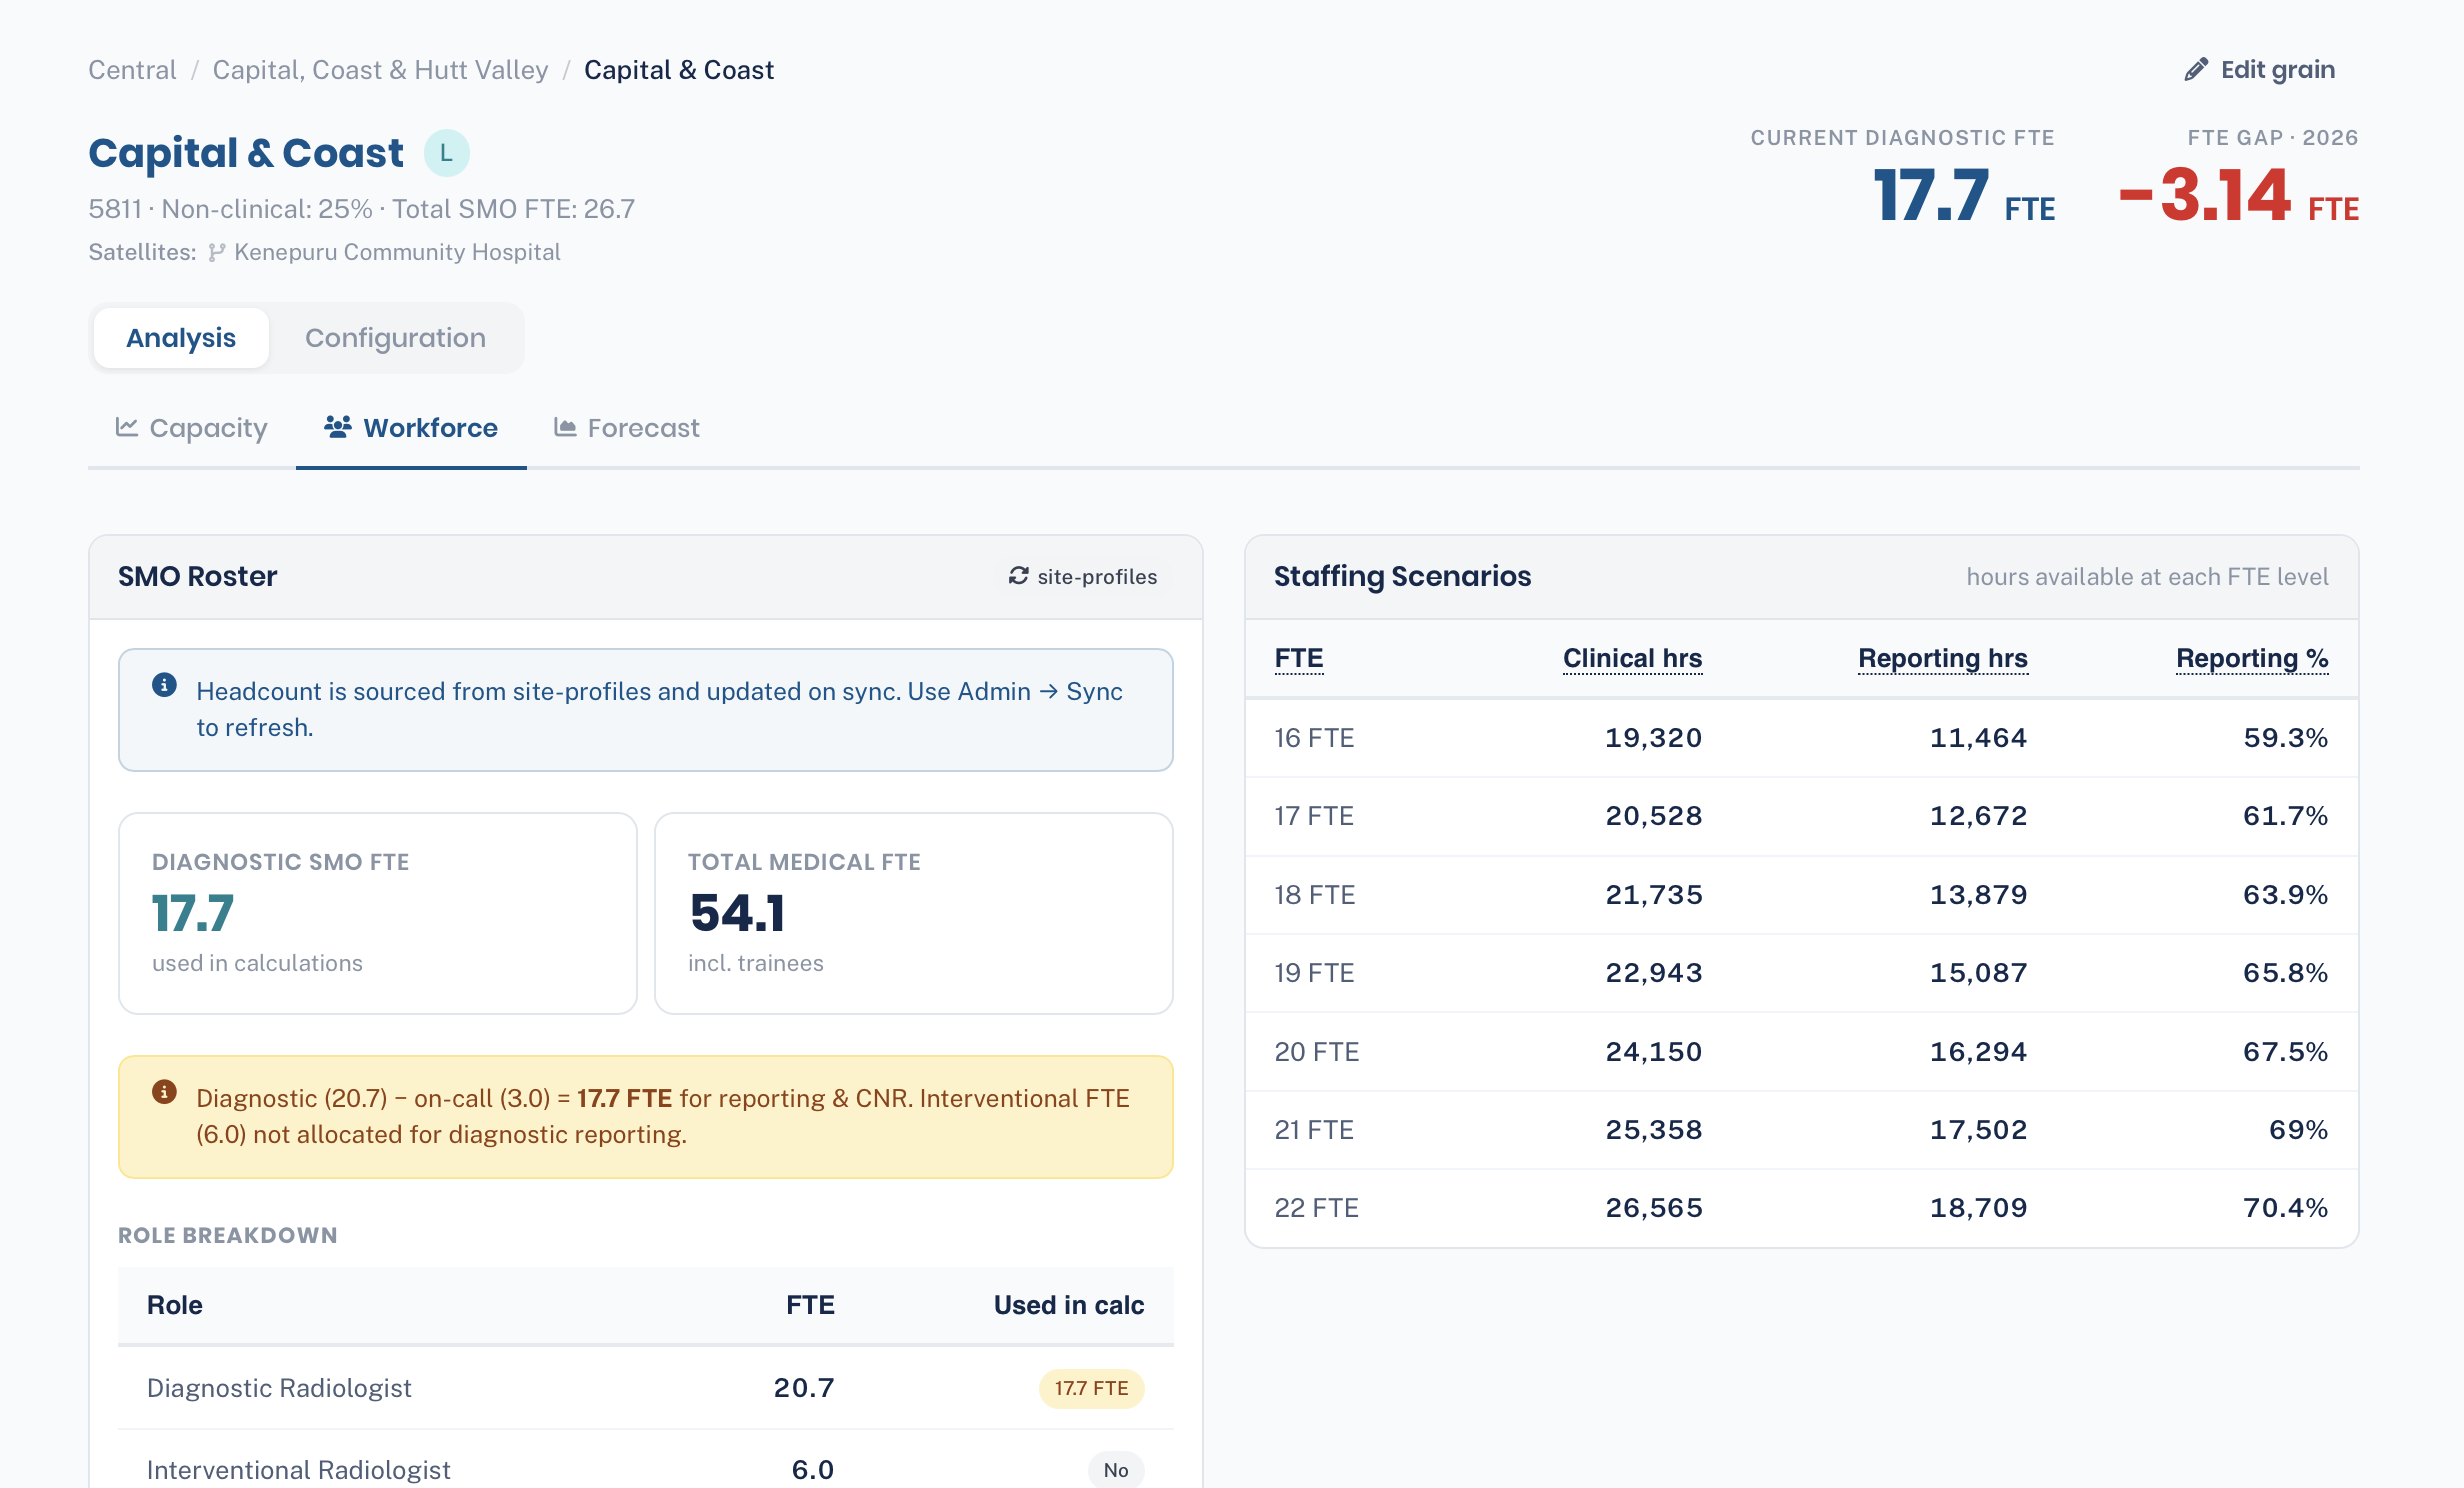
The SMO Roster: diagnostic SMO FTE, total medical FTE and the role breakdown, with the on-call and interventional adjustments that turn current FTE into effective FTE. Staffing Scenarios below it gives the clinical and reporting hours available at each FTE level.
- These figures come from Site Profiles and are read-only here. A change to the roster is made in Site Profiles, and an administrator then runs Sync.
Forecast
A 10-year FTE forecast for a chosen demand scenario (actual, base, high or low), drawn against current FTE, with a year-by-year table under the chart. It needs demand volumes for several years under that scenario.
The Configuration tabs hold the inputs. Editors can change them for grains in their own regions.
Baseline Volumes
The annual examination counts that drive reporting workload, per modality, by complexity (simple or complex) and patient type (inpatient or outpatient), with in-house and outsourced counts kept apart.
- Simple and complex are entered separately because each has its own time constant.
- Outsourced counts feed the All activity view on the Capacity tab.
- Baseline volumes are used when a grain has no demand volumes for the year being viewed.
Non-Reporting
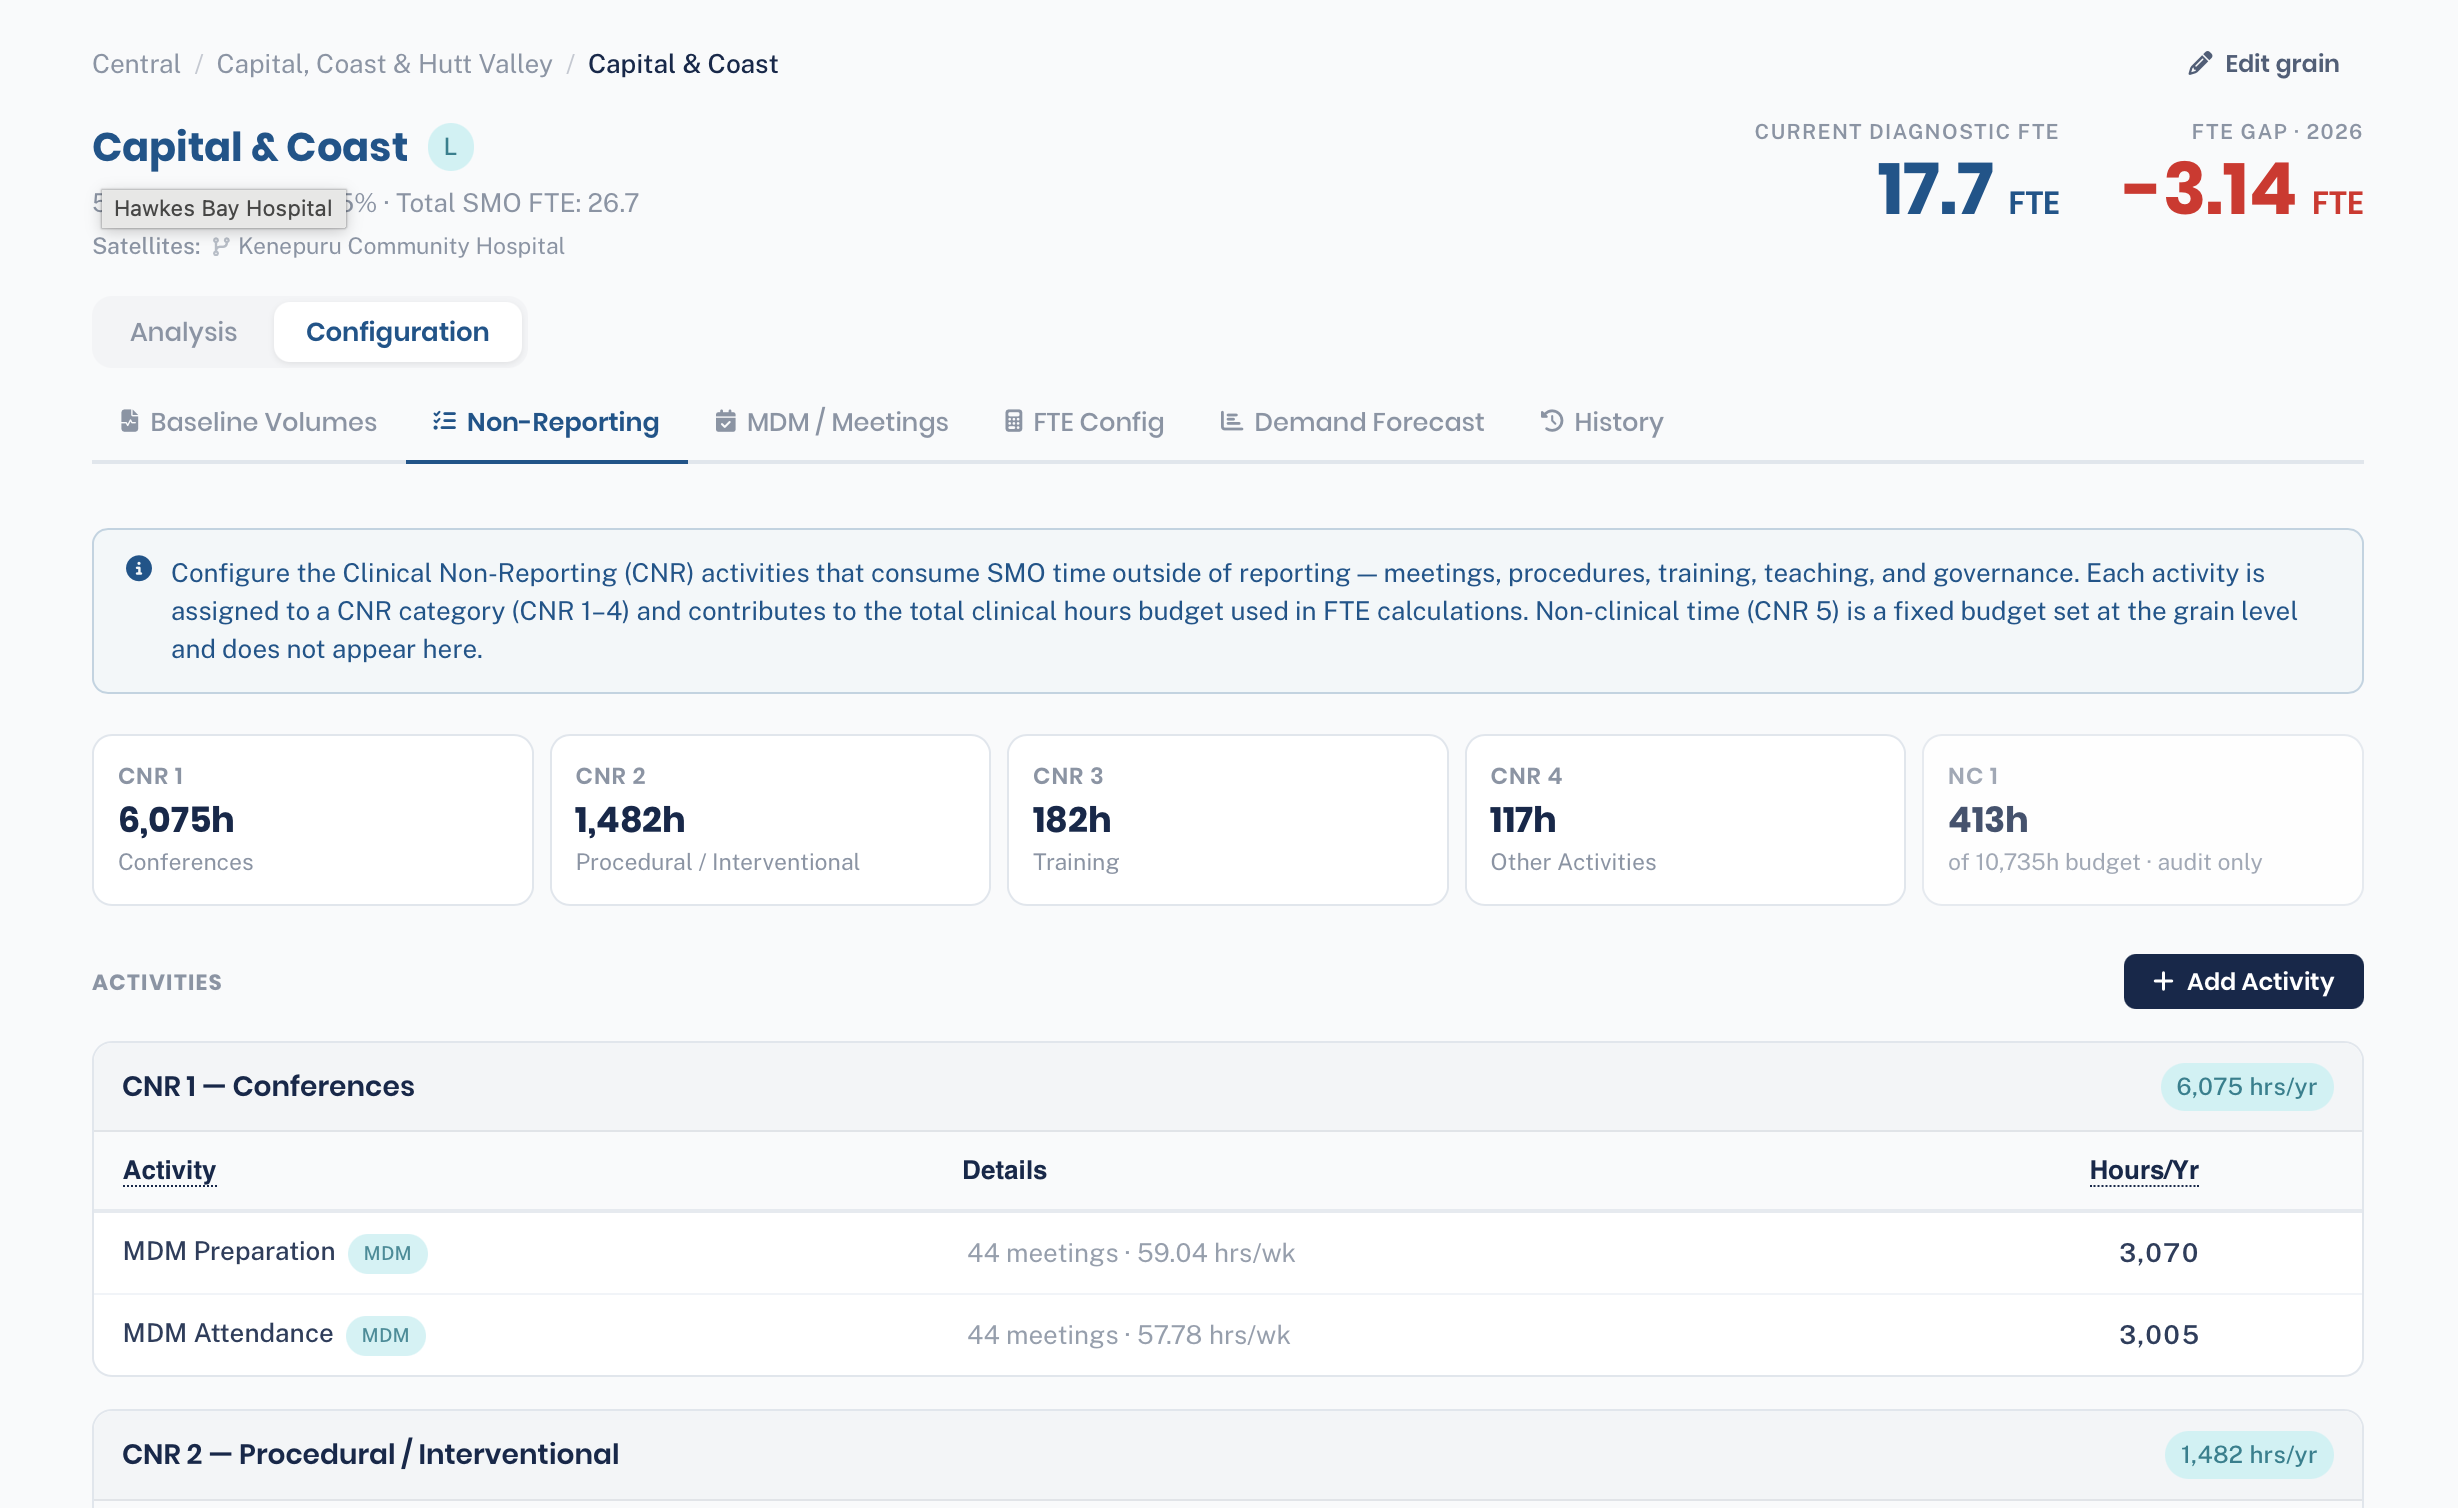
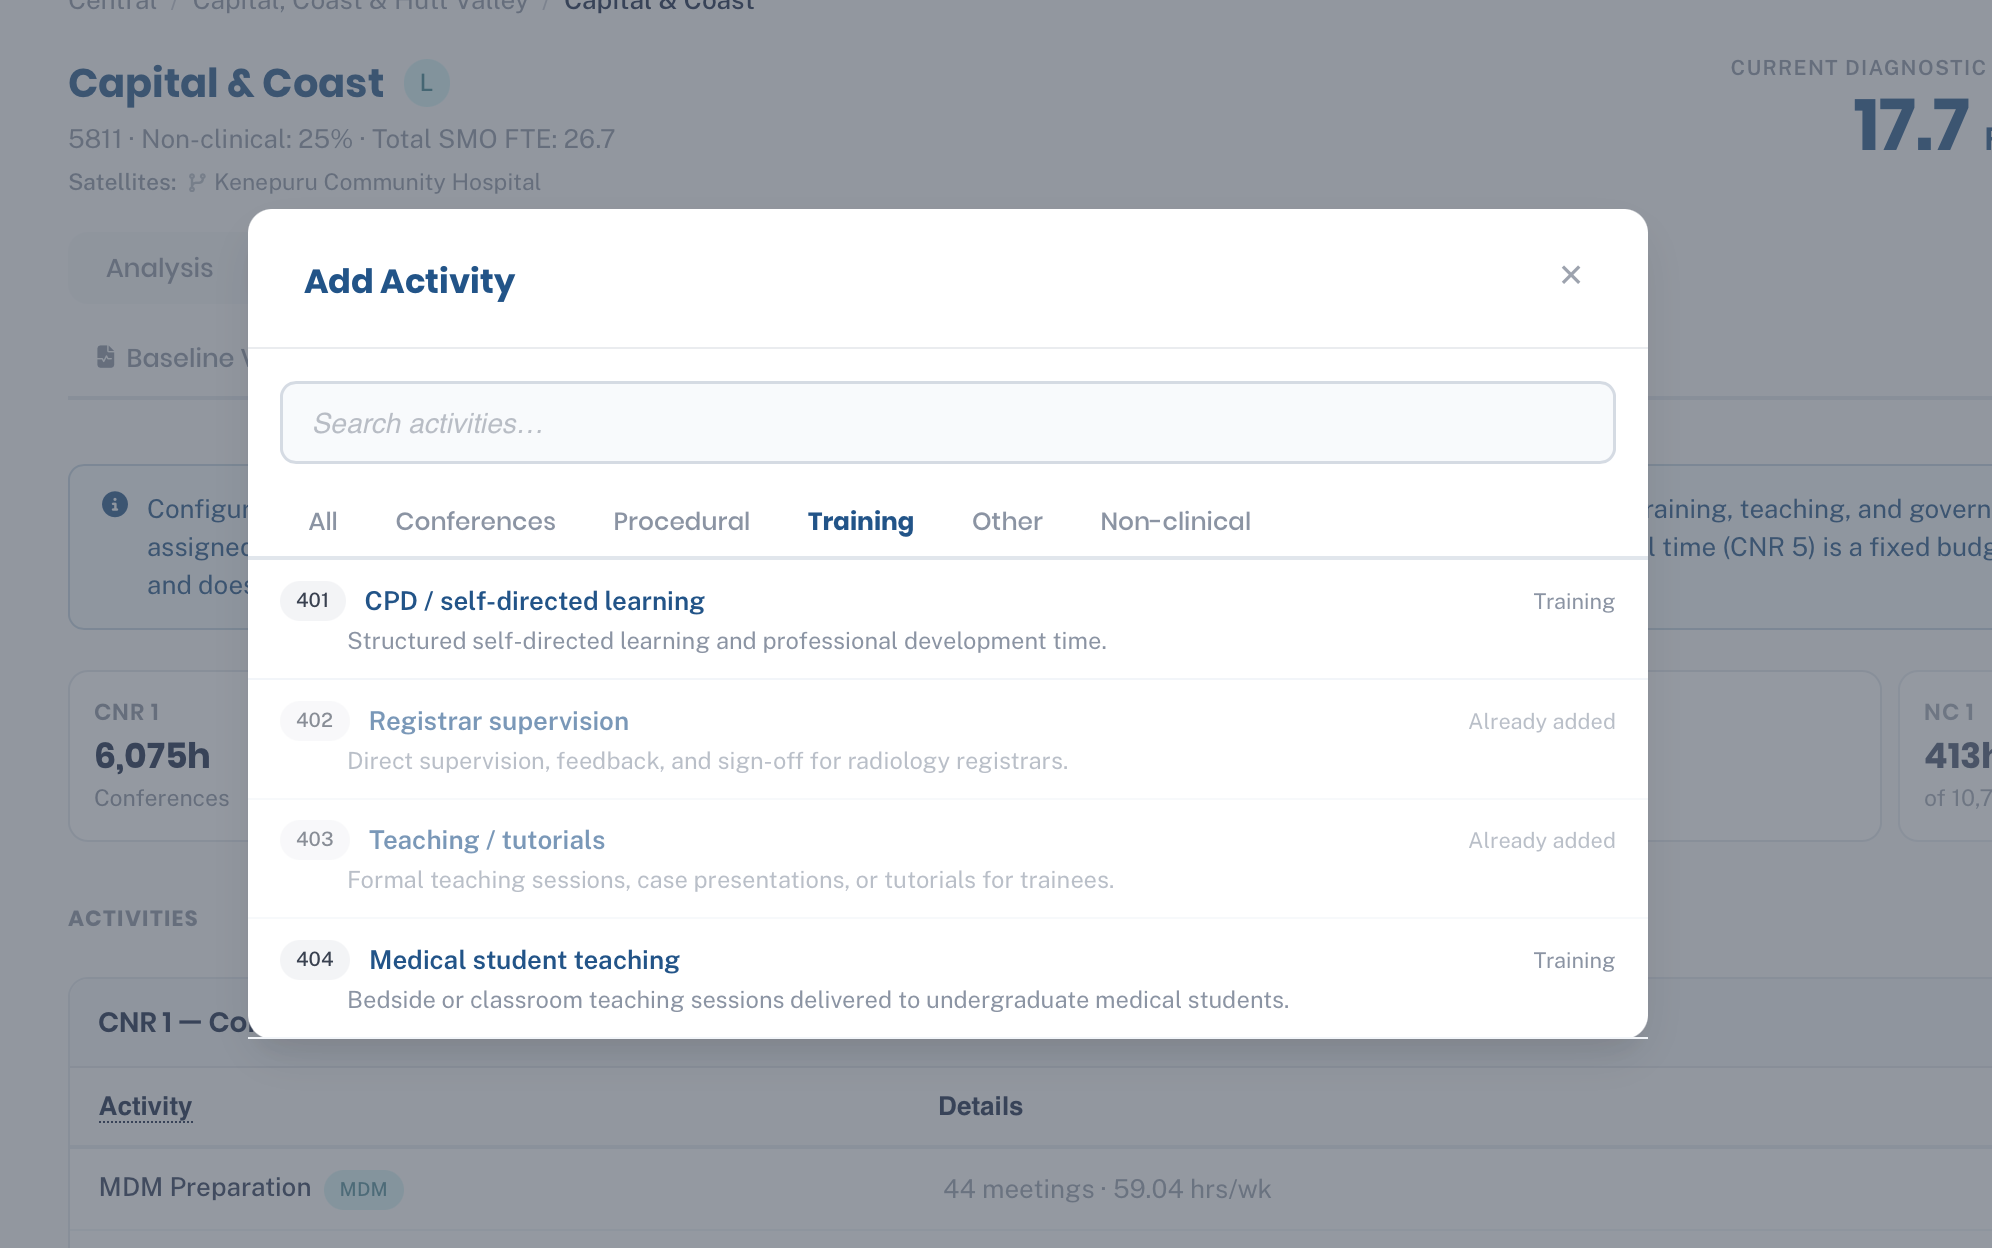
Every clinical task that is not reporting. Add Activity offers the standard tasks from the Library, filtered by category, or a custom task can be entered. Each activity has a CNR category, a unit of measure, the minutes per unit and an annual volume.
- The categories are CNR 1 Conferences, CNR 2 Procedural / Interventional, CNR 3 Training and CNR 4 Other Activities.
- MDM preparation and attendance appear here under CNR 1, but they are set up on the MDM / Meetings tab and should not be entered again as activities.
- Non-clinical tasks can be listed for the record. They add no hours; non-clinical time is the percentage on FTE Config.
MDM / Meetings
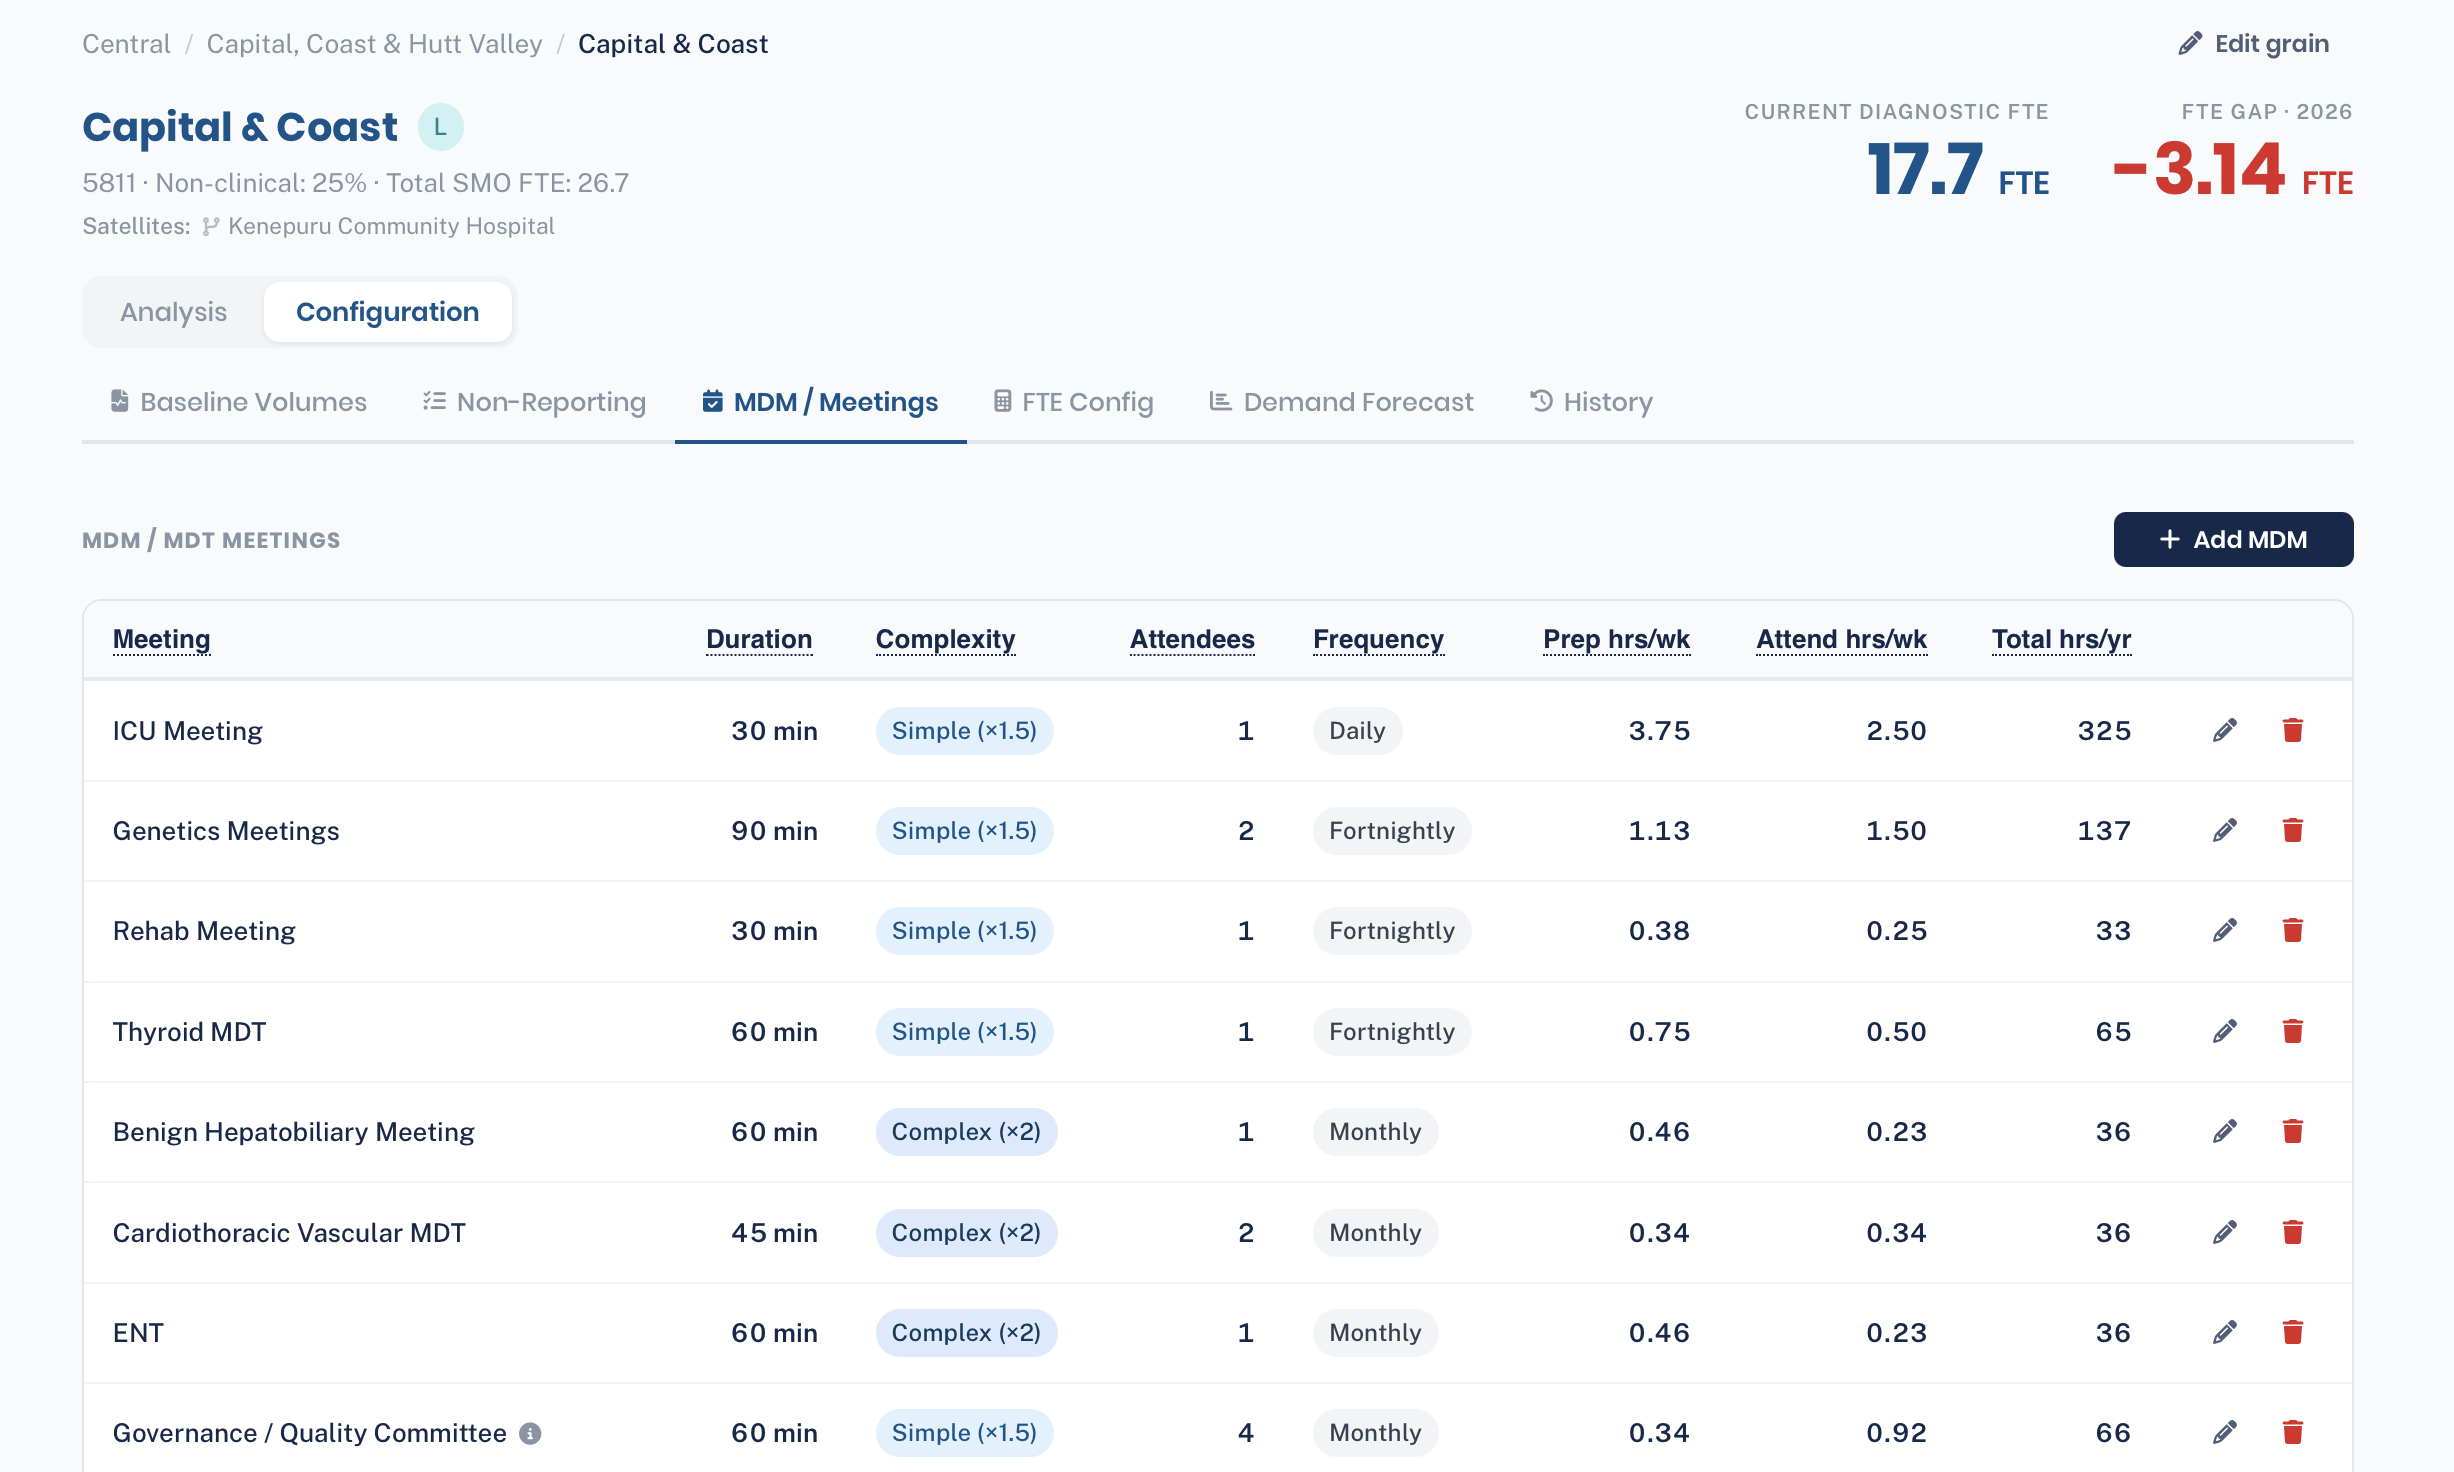
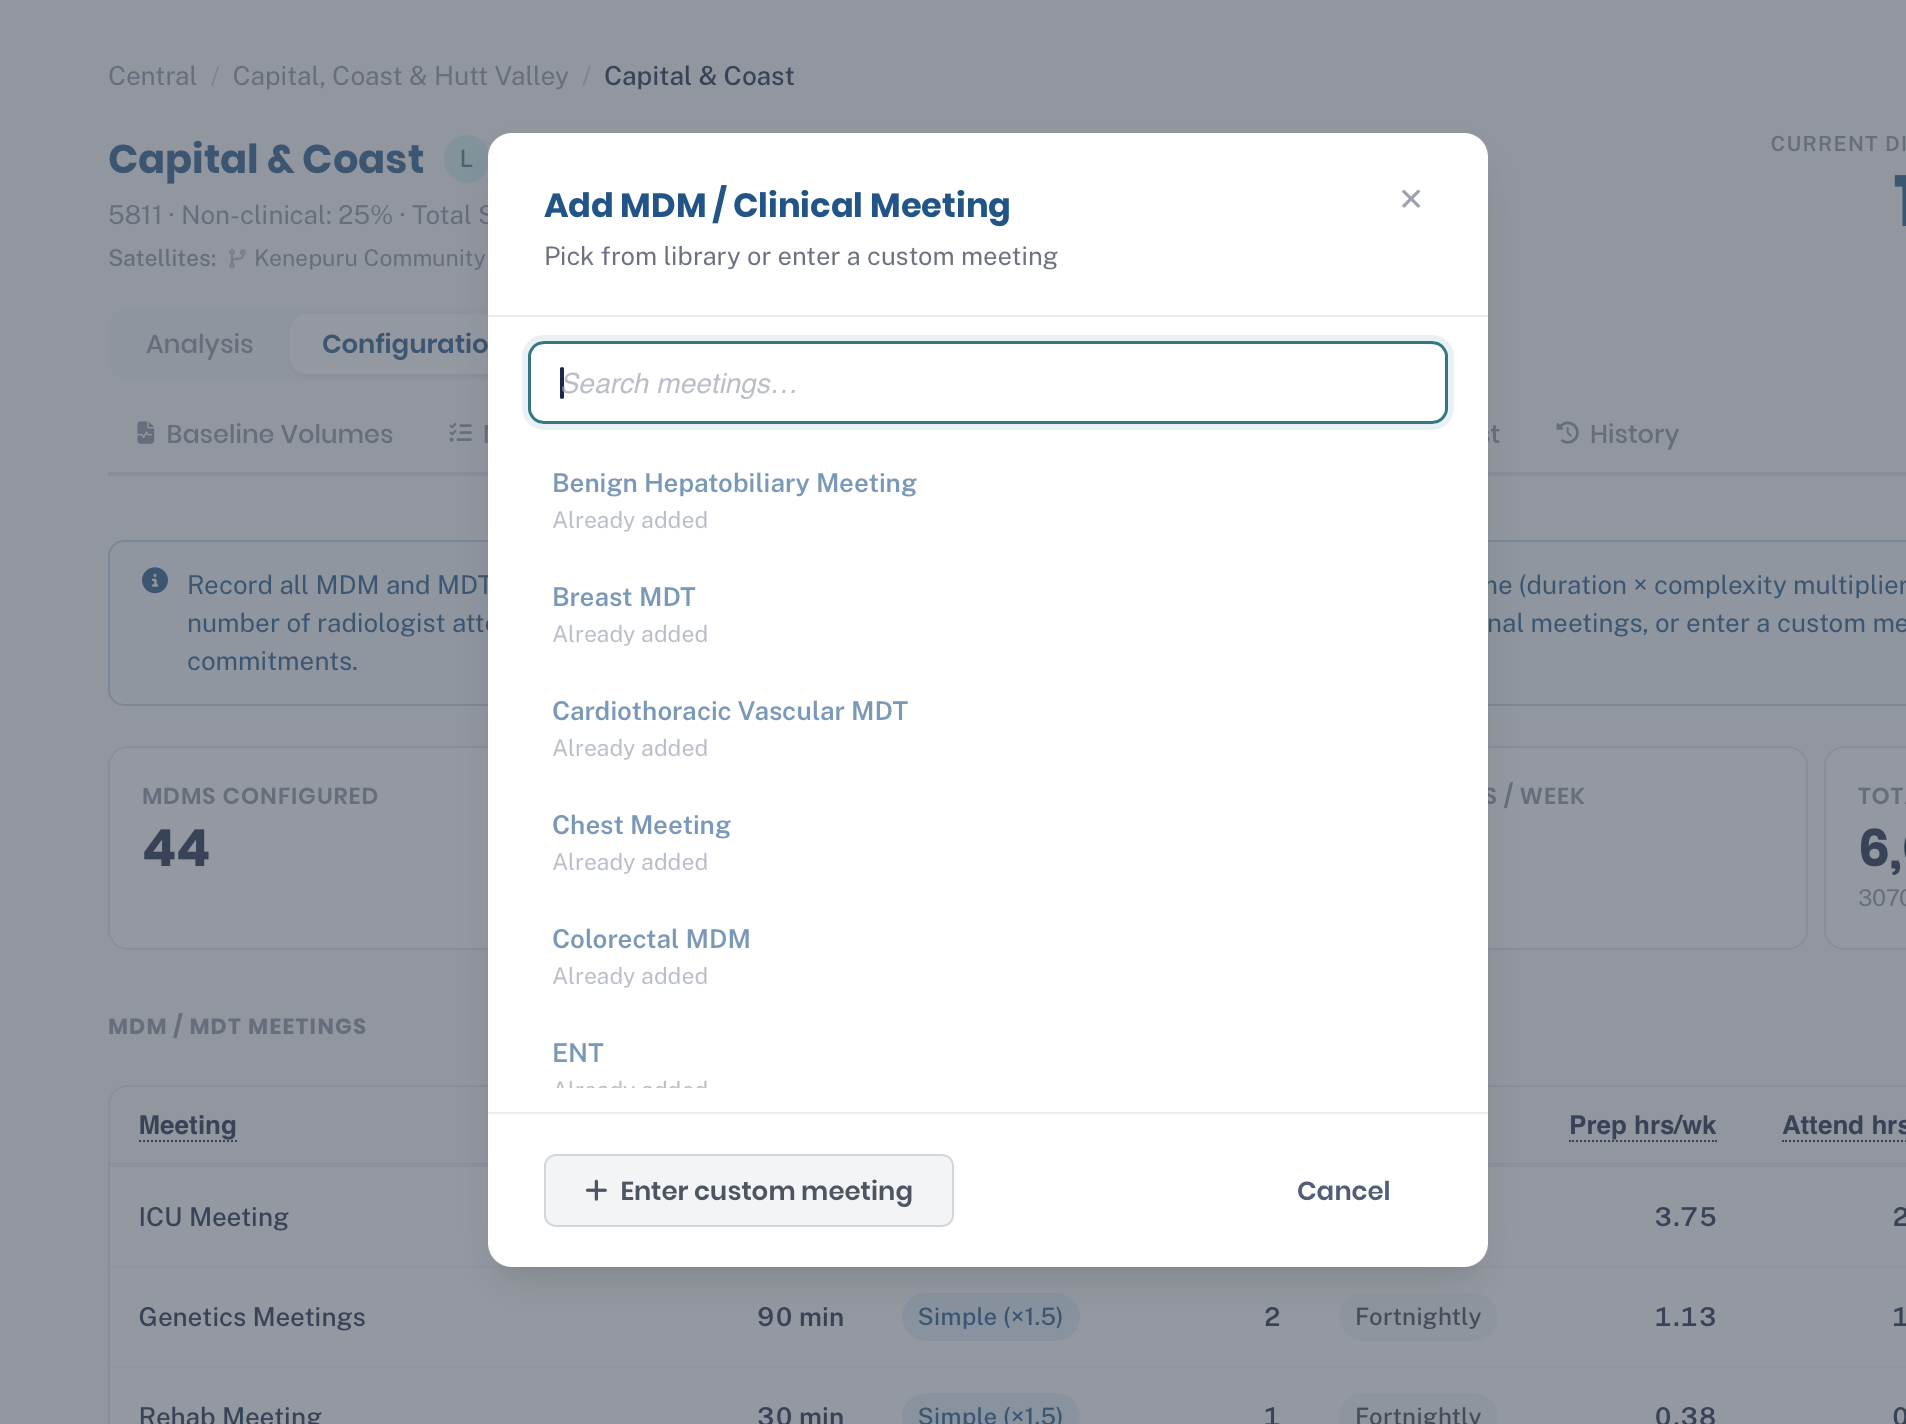
Recurring multidisciplinary meetings, each with a frequency, a duration, a prep time setting and the number of radiologists who attend. The tool works out the annual hours and adds them to CNR 1 Conferences.
- Frequency is daily (five a week), weekly, fortnightly or monthly.
- Attendance grows with each attendee, so only the radiologists who attend should be counted.
- Total hrs/yr is the figure that goes into the Capacity result.
FTE Config
What one FTE is worth at this grain. It starts from standard annual hours and takes off each kind of leave: annual, public holidays, training, sick and other. Productive hours update as the figures are typed.
- The non-clinical percentage covers administration and support time that is not listed as activities.
- On-call FTE is taken off diagnostic capacity.
- Interventional reporting allocation adds back the part of interventional radiologist time spent on diagnostic reporting, up to the grain's interventional FTE.
- Each grain has its own settings, so a small rural service and a tertiary centre can carry different assumptions.
Demand Forecast
Examination volumes for a chosen year and scenario (actual, base, high or low), by modality, patient type and complexity. Where volumes exist for the year being viewed, the calculation uses them in place of baseline volumes. Volumes across several years drive the Forecast tab.
History
Every change to the grain, with the email of the person who made it and when.
Library
The standard activities and MDM meetings, with default values. Each is marked as a default for one or more archetypes.
Time Constants
The national minutes per report for each modality and complexity, and the global settings, including the MDM prep multipliers. A change applies to every grain.
CSV Upload
Imports baseline volumes or demand volumes from a CSV file. A template can be downloaded with every current grain filled in. Open to editors as well as administrators.
Sync
Creates and updates grains from Site Profiles facilities and refreshes their staffing. A satellite facility is attached to its parent's grain. Merged grains are listed here and can be unmerged.
Who can do what
Sign-in is through the HNZ Rad Tools identity hub. An administrator gives each person access, and gives editors the regions they can edit.
| Task | Viewer | Editor | Admin |
|---|---|---|---|
| See the National Overview, results and forecasts | Yes | Yes | Yes |
| Compare grains and read history | Yes | Yes | Yes |
| Edit a grain's configuration and volumes (editors: in their regions) | No | Yes | Yes |
| CSV Upload | No | Yes | Yes |
| Merge and unmerge grains, run Sync | No | No | Yes |
| Manage the Library | No | No | Yes |
| Edit Time Constants and global settings | No | No | Yes |
Where to find it
Workforce Sizing is at service-sizing.hnzradtools.nz, and the HNZ Rad Tools portal links to it. It needs a sign-in, and access is by request: an administrator sets it up in the identity hub. Inside the app, Help & Guide in the sidebar covers the same ground as this page.
How it is built is in the architecture pack (Health NZ staff sign-in).